
Agentforce Observability: How to Tell What Your Live Agents Are Actually Doing
Agent Analytics, Agent Optimization, and Agent Health Monitoring, plus the session trace data underneath. What each signal measures, how stale it is, and where it misleads you.

The agent went live in June. Six weeks later the deflection number on the weekly slide still reads 61 percent, so nobody opens the dashboard again. Then a support manager forwards a transcript: the agent answered a refund question with the shipping policy, apologised, and answered with the shipping policy again. The conversation is four weeks old. It was not the only one.
Deflection never moved, because the session never left the agent. Holding a session and solving a problem produce the same number on that slide. That is the whole problem with running Agentforce on a deflection metric, and it is the reason Salesforce shipped a set of tools most orgs I have looked at still have switched off.
Monitoring says the agent is up. Observability says what it decided.
Traditional monitoring answers questions you already knew to ask. Uptime. Error count. Response time. All useful, and none of them catch an agent that confidently pulls the wrong [knowledge article](/terms/knowledge-article) for six weeks straight.
An agent fails differently from an Apex batch job. A batch job throws, the error lands in a log, someone gets paged. An agent picks a topic, calls an action, gets an empty result back, and writes a fluent paragraph around the emptiness. Nothing errors. The customer gives up and calls the contact centre instead, which shows up in your call volume three weeks later as a mystery.
Gartner put a number on where this goes. It expects more than 40 percent of agentic AI projects to be cancelled by the end of 2027, with escalating costs, unclear business value, and weak risk controls at the top of the list. Two of those three are observability failures before they are strategy failures. You cannot defend a spend you cannot measure, and you cannot fix a quality problem you never saw.
Salesforce made Agent Analytics and Agent Optimization generally available in April 2026, with Agent Health Monitoring following after a closed beta. Together they cover the post-deployment half of the agent lifecycle. The pre-deployment half already had Agentforce Testing Center, and the two are not substitutes for each other.
Four layers, and knowing which one answers your question
Agentforce Observability is not one screen. It is four things stacked, and picking the wrong layer for a question wastes a lot of clicking.
Session tracing is the foundation. Every turn, message, large language model call, action invocation, and guardrail check gets written as structured trace data into Data Cloud, now branded Data 360. Nothing above this layer exists without it.
Agent Analytics is the reporting layer, rendered through Tableau Next. Total sessions, deflected sessions, escalation rate, abandoned sessions, feedback averages, and topic-level breakdowns.
Agent Optimization is the diagnostic layer, and it lives inside Agentforce Studio. It cuts sessions into moments, clusters those moments by intent, and scores response quality.
Agent Health Monitoring is the alerting layer. Three metrics, a five-minute refresh, thresholds you set, and an email when one gets crossed.
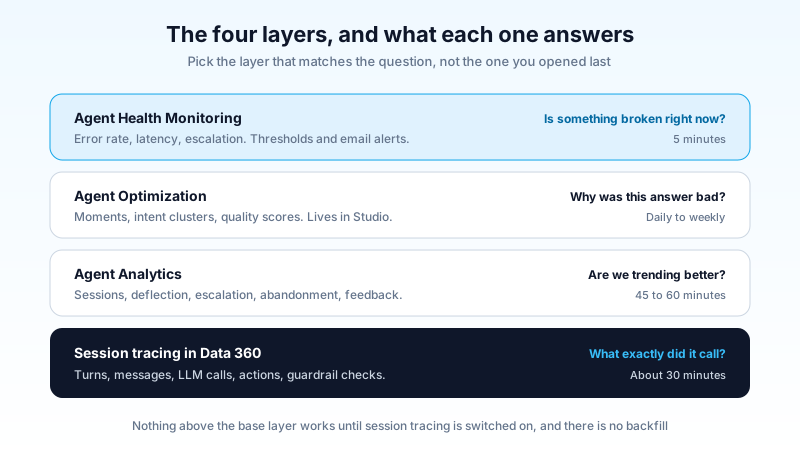
Read it as a question router. "Are we trending better this month" is Analytics. "Why did this specific answer suck" is Optimization. "Is something broken right now" is Health Monitoring. "What exactly did the reasoning engine call, and how long did each step take" is session tracing.
Turn it on before you need it
Here is the step that costs orgs a full quarter of data: analytics and insights only appear for conversations that happen after you set up the session tracing data model. There is no backfill. If your agent has been live since June and you enable tracing in August, June and July are gone. Permanently.
The setup path is Setup, then Einstein Audit, Analytics, and Monitoring Setup. Enable Agentforce Session Tracing and Data Model, then enable Agentforce Optimization. Skip any legacy analytics version you find sitting next to them. Data 360 has to be provisioned and active, which is already true for most Agentforce orgs, since the Data Library and the Einstein Trust Layer both depend on it.
Then the permissions, which is where access breaks quietly:
- Access Agentforce Optimization for the Studio diagnostic views.
- Tableau Next Limited Consumer or Tableau Next Platform Analyst for the analytics dashboards. The Limited Consumer license ships with Salesforce Foundations, so most orgs already have it.
- Data Cloud User for the data underneath.
- API Enabled on the user's profile. Miss this one and the metric cards on Tableau Next simply fail to load, with no error that points at the cause.
Do all of it on the day the agent reaches production, not the day someone asks why CSAT dropped. Setup takes twenty minutes. Waiting costs you the only thing that cannot be recovered, which is history.
Every one of these numbers is stale
The refresh cadences are published, they differ by an order of magnitude, and nobody reads them until a number looks wrong.
| Signal | Refresh cadence |
|---|---|
| Agent Health metrics | 5 minutes |
| Session tracing data | About 30 minutes |
| Agent Analytics metrics | 45 to 60 minutes |
| Moments and quality scores | Daily |
| Intent tags and clusters | Weekly |
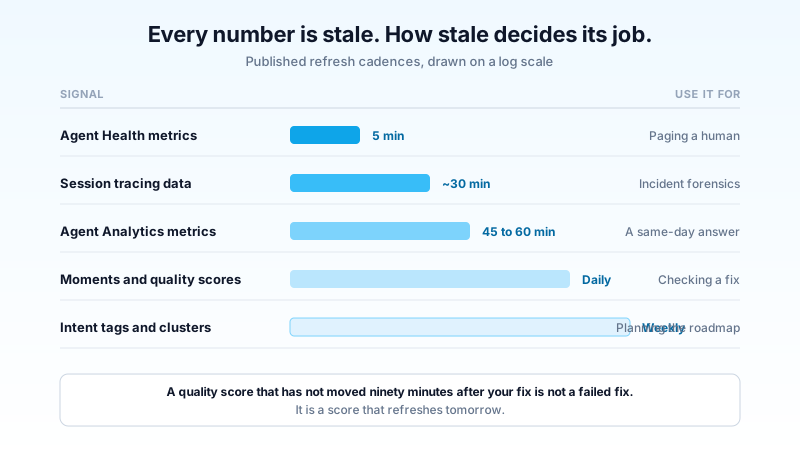
That table is an operating schedule in disguise. Health Monitoring is the only signal fast enough to page a human. Analytics gives you a same-day answer. Quality scores give you a next-day answer. Intent tags give you a next-week answer, which makes them a planning input and a terrible incident tool.
I have watched a team spend an afternoon convinced their fix had failed because the quality score had not moved. The score refreshes daily. The fix had shipped ninety minutes earlier.
The numbers, and what each one hides
Deflection rate counts sessions that ended without a human. An agent that stonewalls politely deflects beautifully. On its own this number rewards exactly the behaviour you do not want, so read it next to abandonment and quality score or do not read it at all.
Escalation rate is the share of sessions handed to a human. Low escalation is not automatically good either. A well-tuned agent for a complex product might sit at 30 percent escalation and be doing its job perfectly, because the 70 percent it kept were the ones it should have kept. Track the direction, not the absolute.
Abandoned sessions is the honest metric of the set. The customer left mid-conversation. There is no charitable reading of that, and it is the first place I look when deflection and escalation both look healthy.
Agent error rate is the percentage of responses that fail, covering both action errors and LLM errors. This is the closest thing to a classic monitoring metric, and it is the one your integration bugs show up in.
Average interaction latency measures time from request to response. Small improvements here move satisfaction more than most content changes do, because a customer waiting eight seconds for a sentence has already decided what they think of your agent.
Pair them. Deflection with abandonment tells you whether the sessions you kept were actually resolved. Escalation with quality score tells you whether the handoffs are a safety valve or a symptom. One number alone will always flatter you.
Moments, intents, and a score from 1 to 5
Agent Optimization works in units called moments. A moment is a slice of a session carrying one distinct user intent, so a single conversation that starts with an order status question and ends with a refund request produces two moments, not one. That granularity is what lets you aggregate the same request across thousands of sessions and see the shape of your actual traffic instead of your assumed traffic.
Moments get clustered into intents, and the clusters get labelled with system tags generated weekly through cross-session analysis. Clustering needs volume: roughly 30 days of data or 50,000 moments to work from, and a cluster needs at least 10 associated moments before it earns a tag. A pilot doing 200 conversations a week will not produce a useful tag set for a couple of months, which is a fair reason to run the pilot bigger or accept that you are flying on session traces alone for a while.
Quality score runs 1 to 5 and rates how relevant and helpful the response was, using LLM-as-judge evaluation. Each session and each intent gets a rating plus a short written explanation of why. The explanation is the useful part. A bare score tells you something is wrong; the explanation tells you whether the agent misread the intent, picked the wrong topic, or got a good plan and a bad answer from the action.
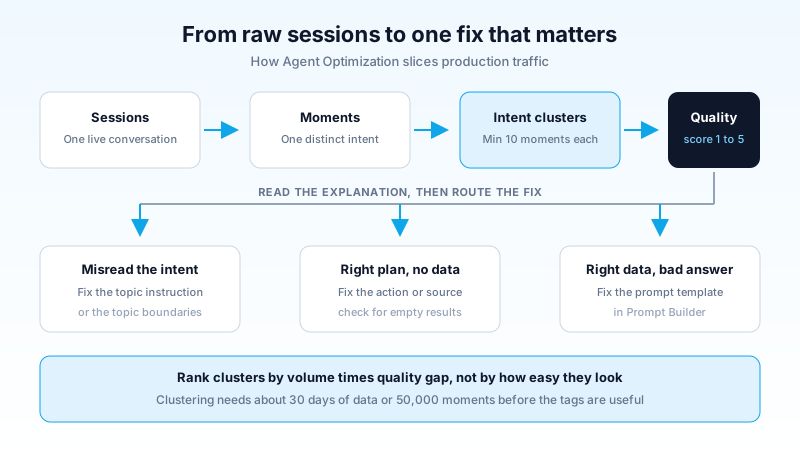
The workflow that actually produces fixes: sort intents by volume, filter to the low quality scores, open the three worst-scoring moments in the biggest cluster, and read the transcripts end to end. Then route the fix to the right layer. A misread intent is a topic instruction problem. A correct plan with an empty result is an action or data problem. A correct result phrased badly is a prompt problem, and that is where Prompt Builder comes in. Salesforce has also been extending quality scoring so evaluation criteria can be customised through Prompt Builder, which matters if your definition of a good answer is domain-specific.
Do not fix the smallest cluster first because it is easiest. Volume times quality gap is the ranking that pays.
Health Monitoring is the pager, not the report
Three metrics: agent error rate, average interaction latency, escalation rate. Five-minute intervals. Thresholds you configure per metric, an email when one is crossed, and a 30-minute cooldown by default so one bad afternoon does not generate eighty notifications.
Five-minute granularity is the entire point. A daily average absorbs a twenty-minute outage without flinching. Your customers do not. The failure mode this catches has a name inside Salesforce, the silent failure, and it describes exactly the case where nothing throws loudly enough to reach anyone until a customer complains.
Set thresholds off your own baseline, not off a number someone posted on LinkedIn. Run two weeks, take the median and the spread for each metric, then set the alert somewhere you would genuinely want a human to look. An alert that fires every day gets filtered into a folder by week three, and then you have no alerting at all while believing you do.
When the dashboards run out: trace trees and SOQL
Dashboards answer "what" well and "why" poorly. For why, there is Agent Platform Tracing, which records the execution chain as spans and lets you rebuild it as a tree.
Enable it at Setup, Agent Platform Tracing, one toggle. Data 360 needs to be provisioned, users need the Data Cloud Data Access permission set plus read on the relevant objects, and spans start landing within minutes of the next agent run.
The span operation names map directly to what the reasoning engine did:
run.topicfor topic routingrun.llmstepfor a model callrun.invokeActions.FLOWfor a flow invocationrun.action.*for Apex and other actionsrun.createrecordfor a write
Each span carries a duration in milliseconds, a status of OK or ERROR, and a parent span id you use to reassemble the tree. It all lands in Data 360 data model objects, so you can query it directly instead of clicking through a UI:
SELECT ssot__Id__c, ssot__OperationName__c, ssot__DurationNumber__c, ssot__StatusCode__c
FROM ssot__TelemetryTraceSpan__dlm
WHERE ssot__TelemetryTrace__c = 'YOUR_TRACE_ID'
ORDER BY ssot__StartDateTime__c ASC
Join ssot__AiAgentInteraction__dlm on the shared trace id when you need the conversation text next to the timings. That pairing is what turns "the agent was slow" into "the agent was fine, your enrichment callout took 3.4 seconds of the 4.1".
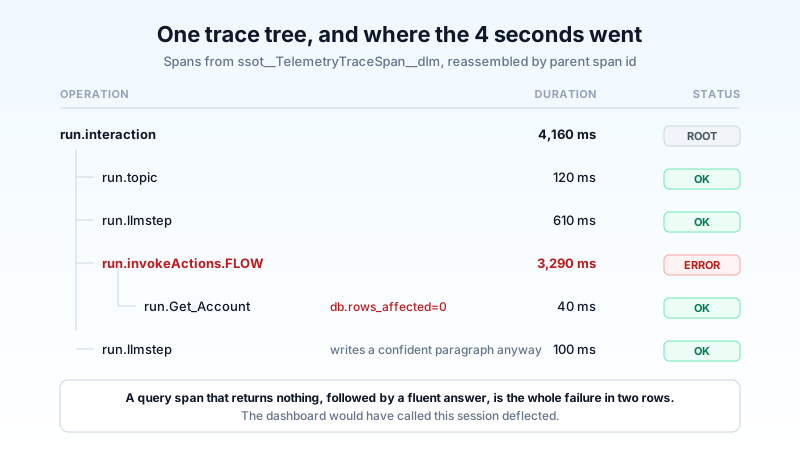
Watch for spans with db.rows_affected=0. A query span that returns nothing, followed by an LLM span that produces a confident paragraph, is the exact signature of the failure this whole post opened with.
Getting traces out to Datadog or Splunk
If your organisation already runs a central observability platform, you do not have to leave Agentforce data stranded in Salesforce. There is a REST endpoint that returns a full session trace in OpenTelemetry Protocol v1.0 format:
GET /services/data/v66.0/einstein/audit/otel/{session-id}
The unified trace covers turns, messages, LLM calls, actions, metric scores, and feedback, pulled from both the session tracing data model and the Generative AI Audit and Feedback data model. Auth is OAuth 2.0 through an external client app. Any platform that ingests OTLP takes it without transformation, which in practice means Splunk, Datadog, and New Relic.
Two constraints shape the design. You query one session per call, and the session must have started within the previous 72 hours. That makes this an incident and streaming tool, not a bulk export. If you want long-term agent telemetry in your data lake, build a scheduled pull that runs well inside the 72-hour window, or query the DMOs in Data 360 directly and ship those.
What this does not cover
Agentforce agents only. Observability reads Agentforce's own session data, planner traces, and RAG components. A bespoke LLM service you built and called from Apex is invisible to it, and so is any third-party agent in your estate. Anyone running multi-agent orchestration across mixed platforms needs a second pane of glass, which is exactly the sort of design decision the Well-Architected guidance for Agentforce asks you to make on purpose rather than by accident.
Coverage varies by agent type. Agentforce Service Agent and Employee Agent get both Analytics and Optimization. Default Agent gets Optimization but not Analytics. SDR agents get Analytics but not Optimization. Check your agent type before you promise anyone a dashboard.
It is not a substitute for pre-production testing. Observability tells you what went wrong in front of a customer. Testing Center tells you before there is a customer. If you are only running one of the two, run the one that catches regressions in a sandbox first, and the Testing Center guide covers how to wire those checks into a release.
All of this consumes Data 360. Session traces, moments, and analytics objects are storage and processing in a metered product. That is not a reason to skip it. It is a reason to include it in the running cost of the agent, rather than discovering it on an invoice.
The weekly loop that makes the setup worth it
Twenty minutes on Monday: open Agent Analytics, check deflection, escalation, and abandonment against last week, and note anything that moved more than a few points in either direction.
Thirty minutes on Tuesday: open Agent Optimization, sort intents by volume, filter to quality scores of 1 and 2, and read three transcripts from the largest low-scoring cluster. Write down which layer each failure belongs to.
The rest of the week: ship one fix, from one cluster, at the right layer. Then check the same cluster's quality score the following Tuesday, remembering that the score refreshes daily and the tags refresh weekly.
That loop is unglamorous and it compounds. An agent that improves by one intent cluster a week is a different product in a quarter, and you will have the before-and-after numbers when someone asks whether the spend was worth it.
Open Setup, search for Einstein Audit, Analytics, and Monitoring Setup, and check whether Agentforce Session Tracing and Data Model is switched on. If it is off and you have an agent in production, turn it on today, because every conversation until you do is a conversation you will never be able to analyse. Then put twenty minutes on next Monday to look at what it collected.
About the Author
Dipojjal Chakrabarti is a B2C Solution Architect with 29 Salesforce certifications and over 13 years in the Salesforce ecosystem. He writes and edits salesforcedictionary.com, published by KineticBit Inc., to help admins, developers, architects, and cert/interview candidates sharpen their fundamentals. More about Dipojjal.
Share this article
Sources
- Learn About Agentforce Observability | Salesforce Help
- Agentforce Observability Setup and Access | Salesforce Help
- Export Agentforce Session Tracing Data | Agentforce Developer Guide
- Agent Platform Tracing: Debug Agentforce with Trace Trees, SOQL, and Slack | Salesforce Developers Blog
- Gartner Predicts Over 40% of Agentic AI Projects Will Be Canceled by End of 2027
Related dictionary terms
Practise it
Five questions on Agentforce Specialist
Exam-style questions with an explanation after each one. No account needed, and your answers build a weak-topic map once you have one.
Keep reading

Agentforce Testing Center: The Complete Guide to Testing Your AI Agents in 2026
Testing Center is the Agentforce tool for validating AI agents before they ship. Synthetic test users, conversation-level checks, custom evaluations, and DevOps quality gates. Here's how to use all of it.

Salesforce Multi-Agent Orchestration: The Complete 2026 Guide
In 2026, orgs run an average of 12 AI agents - half in isolated silos. Learn the primary-and-specialist architecture, Agent Fabric, and the A2A protocol that turn agent sprawl into coordinated enterprise AI.

Salesforce Well-Architected for Agentforce
TDX 2026 unveiled the next chapter of Salesforce's Well-Architected Framework, evolving the Trusted, Easy, and Adaptable pillars specifically for Agentforce. Here's what changed and how to apply it to every agent you build.
Comments
No comments yet. Start the conversation.
Sign in to join the discussion. Your account works across every page.