
Inside the Agentic Enterprise Index
Salesforce published the second edition of its agent-adoption report on Friday. The average customer runs 13 agents, deploys one in 1.9 days, and has produced 734 million Agentic Work Units. The sample and the metric both need reading before you quote any of it.
Salesforce published the second edition of its Agentic Enterprise Index on Friday. The headline is that customers more than doubled their agent count in fifteen months, from an average of 5 in February 2025 to 13 by April 2026. The number underneath the headline is 734 million, and that is the one worth arguing about.
This is the first hard adoption data Salesforce has released since KeyBanc downgraded the stock in July over weak Agentforce traction. It arrives with a rebuttal built in. It also arrives with a sample definition that changes what the numbers mean.
What the Report Actually Measures
The window is February 2025 to April 2026, five quarters. The data is aggregated product usage from Agentforce and related Salesforce products, and it qualifies a business for inclusion only if that business had activated production agents every month across the whole period. A separate May 2026 survey of 4,689 respondents across the United States, United Kingdom, France, Canada, Australia, Spain and Italy sits alongside it as supplementary research.
Four operational numbers come out of the usage side:
Average activated agents per organisation went from 5 to 13, a 7 percent compound monthly growth rate. Average time to put an agent into production fell to 1.9 days, down 53 percent from the start of the window. Unique skills per agent went from 2 to 6. Actions per account grew at a 31 percent compound monthly rate.
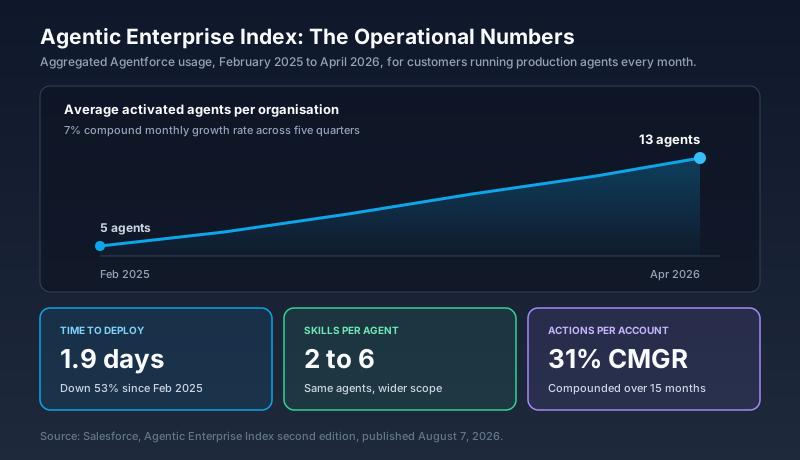
Taken on their own, those four move in a direction that is genuinely hard to fake. Skills per agent tripling is not a marketing artefact. It means the same agents are being handed more scope over time, which is what actual production adoption looks like as opposed to a pilot that got renewed.
The Sample Is Half the Finding
Read the qualifying condition again. A business counts only if it deployed production agents consistently, month after month, for the entire fifteen months.
That is a survivorship filter, and it is doing a lot of work. Every customer who ran a proof of concept and stopped is excluded. Every customer who started in late 2025 is excluded. Every customer who has never switched an agent on is excluded. So the finding is not "the average Salesforce customer now runs 13 agents." It is "the average Salesforce customer who has been running agents continuously since February 2025 now runs 13."
That is still a real and useful number. It tells you what the curve looks like for organisations that got past the first quarter. It tells you nothing about how many organisations got past the first quarter.
KeyBanc's July CIO survey put roughly 23,000 of Salesforce's 150,000 customers on Agentforce in any form. Both figures can be correct at once, and read together they describe the actual state of the market: a minority of the base has adopted, and inside that minority, usage compounds fast. Anyone quoting one number without the other is arguing rather than reporting.
734 Million of What
The volume metric is the Agentic Work Unit. Salesforce defines an AWU as one discrete unit of work completed by an agent: a task reasoned through, a decision made, an action taken. As of April 2026, Salesforce's own Agentforce agents had produced 734 million of them, growing at roughly 15 percent month over month.
Analysts have been unhappy with this metric since it was introduced in February, and the objection is specific rather than reflexive. Robert Kramer of Moor Insights and Strategy put it as "AWU measures execution rather than accuracy. It tracks activity, not quality." Sanchit Vir Gogia of Greyhound Research made the sharper version: without explicit classification between attempted, succeeded, accepted and validated actions, an AWU count is a throughput number. Liz Miller at Constellation Research has described it as a usage-based consumption metric wearing an outcome metric's clothes.
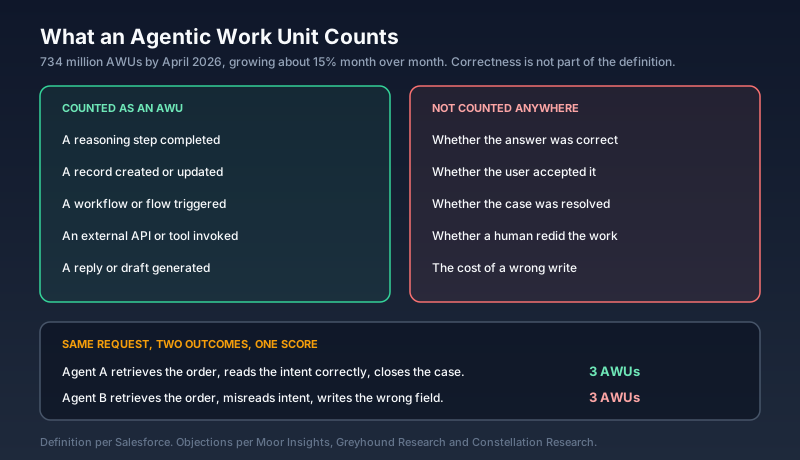
Here is the version that matters at your desk. An agent receives a service request, retrieves the order, misreads the intent, and updates the wrong field on the wrong record. That is three AWUs. An agent that receives the same request, retrieves the same order, reads it correctly and closes the case is also three AWUs. The counter cannot tell them apart, and the second one is the only one your customer would pay for.
None of that makes 734 million meaningless. It makes it a measure of scale rather than a measure of value, which is fine as long as nobody puts it on a slide where an ROI figure belongs.
The Most Honest Number in the Report
The one statistic Salesforce could easily have buried is the escalation rate. Customer service sessions handled by agents grew roughly 170-fold across the five quarters. Across that entire increase, the escalation rate held steady at about 32 percent.
Seven out of ten interactions resolved without a human. That is a defensible result at that volume. It also means one in three still reaches a person, and that ratio did not improve as scale increased. A stable escalation rate under a 170x load increase is a legitimately strong operational signal, because the usual pattern is that quality degrades when volume climbs. It is not the same thing as the deflection rate improving, and Salesforce did not claim it was.
Two adjacent numbers belong in capacity planning rather than in headlines. Average weekly employee sessions with agents went from 3 to 9. Retailers running agents through the holiday period saw a sales growth rate 4 times higher than those without, which is the report's strongest revenue claim and also its most confounded one, since the retailers who deploy agents early are not a random sample of retailers.
Regulated Industries Are Building the Harder Agents
The most interesting slice is the sophistication index. Salesforce scores agent work across five levels of cognitive complexity, where levels 1 to 3 cover retrieval, summarisation and coordination, and levels 4 to 5 cover writing to systems of record and analysis.
Healthcare and life sciences, financial services and manufacturing score around 40 to 50 on that index. Technology and retail score around 30. The regulated and asset-heavy industries are running agents about 66 percent more sophisticated than the sectors usually described as AI front-runners.
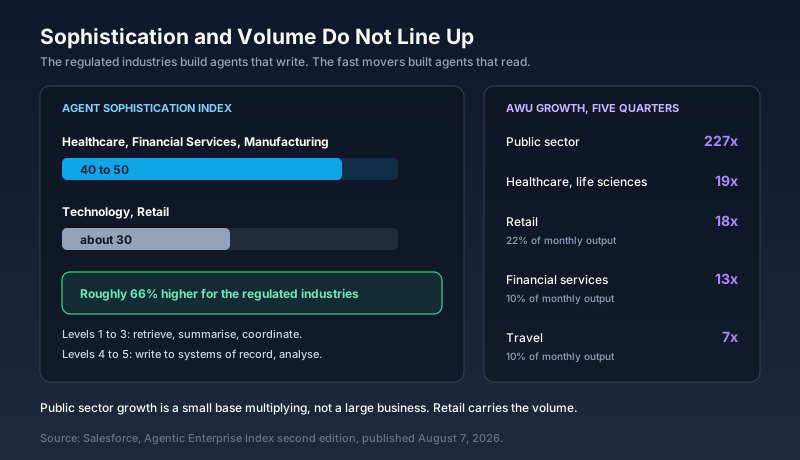
Volume tells a different story from sophistication. Retail produces 22 percent of monthly AWU output with 18x growth. Financial services and travel each produce about 10 percent, growing 13x and 7x. Public sector growth is 227x, which is a small base multiplying rather than a large business, and it lines up with the government deployments Salesforce announced earlier this month.
The pattern is coherent. Industries with strict audit requirements did the data work before they did the agent work, so when they did deploy, the agents could be trusted with write operations. Industries that moved fast shipped read-only assistants and stayed there.
Two Stories, Published the Same Day
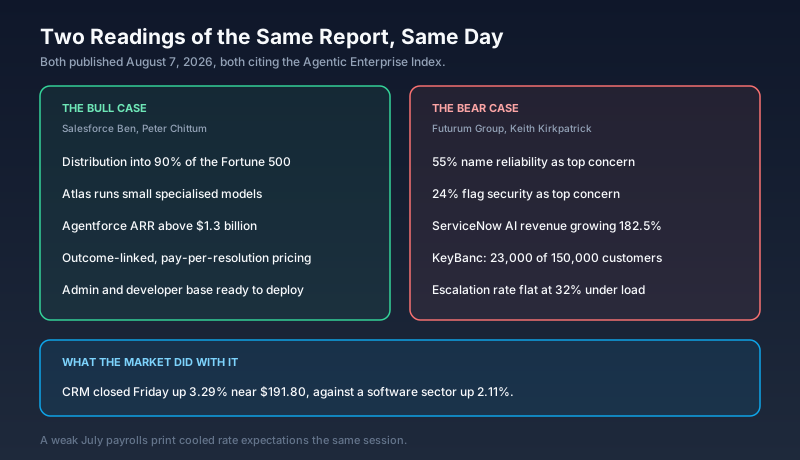
Friday produced a matched pair. Salesforce Ben ran Peter Chittum's argument that Salesforce is positioned to win enterprise AI, resting on distribution into 90 percent of the Fortune 500, the Atlas Reasoning Engine's use of smaller specialised models rather than one large model per task, Agentforce annual recurring revenue past $1.3 billion, and outcome-linked pricing borrowed from acquisitions.
The Futurum Group's Keith Kirkpatrick read the same index and pointed at the friction: 55 percent of organisations cite reliability as their top agentic AI concern and 24 percent flag security, while ServiceNow's AI platform revenue is growing at 182.5 percent.
Joe Inzerillo, president of enterprise AI and technology, offered Salesforce's internal deployment as proof of the model: Slackbot saves the average employee about five hours a week, with 83 percent adoption company-wide. That is a real result. It is also a company with its own data engineers running its own product on its own data model, which is a materially easier problem than the one in front of most orgs.
Markets went with the optimistic read. CRM closed Friday up 3.29 percent at roughly $191.80 against a software sector up 2.11 percent, recovering the previous session's decline after a weak July payrolls print cooled rate expectations. Separately, a WARN notice covering 86 San Francisco roles, filed back in June, took effect the same day, part of a total of 915 workers across the company's filings.
What This Changes For Your Org
Three things are worth doing with this report rather than about it.
Pull your own escalation rate this week and hold it against 32 percent. If your agents escalate more than a third of sessions, the gap is almost never the model. It is grounding data, missing permissions on the agent user, or actions that were scoped to read when the job needs a write. That is a data and configuration problem you can fix.
Do not adopt AWU as an internal KPI in the shape Salesforce publishes it. If you want the volume metric, instrument it with a success classification alongside it: attempted, succeeded, accepted by the user, validated by outcome. Without that split, you will report growth to your steering committee in a unit that cannot distinguish a good quarter from a busy one.
Treat 1.9 days as build time, not project time. That figure measures assembling an agent in an org where the data model, the permissions and the source systems already work. The organisations hitting it spent the preceding quarters on Data 360 grounding and field-level access. The two-day agent sits on top of a much longer piece of work, and skipping that work is how you end up in the third of sessions that escalate.
What To Do Next
Open your Agentforce usage dashboard, note your escalation rate and your average sessions per employee per week, and write both numbers down with today's date next to them. You now have two published benchmarks, 32 percent and 9 sessions, to measure against. Re-check the same two numbers after the Winter '27 sandbox preview opens on August 28, and again after Q2 FY27 earnings on August 26, where the AWU total will almost certainly be quoted without the escalation rate beside it.
About the Author
Dipojjal Chakrabarti is a B2C Solution Architect with 29 Salesforce certifications and over 13 years in the Salesforce ecosystem. He writes and edits salesforcedictionary.com, published by KineticBit Inc., to help admins, developers, architects, and cert/interview candidates sharpen their fundamentals. More about Dipojjal.
Share this article
Sources
- Salesforce Agentic Enterprise Index: Agent Deployments More Than Double Year over Year (Salesforce, August 7 2026)
- Agentic Enterprise Index, Second Edition (Salesforce)
- Agentic AI workforce is more than doubling year on year, says Salesforce (CIO, August 7 2026)
- Salesforce's Agentic Enterprise Index: A Paradigm Shift in AI Deployment (The Futurum Group, August 7 2026)
- AWU by Salesforce: A shiny new metric that tells CIOs little of value (CIO)
- Salesforce's Agentic Work Unit: What you need to know (Constellation Research)
- What are Agentic Work Units (AWU)? (Salesforce)
- Salesforce Is Poised to Win the Enterprise AI Race (Salesforce Ben, August 7 2026)
- Salesforce's Agentforce product maturity questioned as KeyBanc cites weak customer traction (CIO)
- Salesforce Inc Stock (CRM) Moved Up by 3.29% on Aug 7 (TradingKey)
- Salesforce Lays Off 86 Workers, San Francisco CA WARN Notice (WARNTracker)
Related dictionary terms
Practise it
Five questions on Agentforce Specialist
Exam-style questions with an explanation after each one. No account needed, and your answers build a weak-topic map once you have one.
More news
Salesforce Rewires the C-Suite
Srini Tallapragada left the engineering and customer success presidency on August 6 after 14 years. Miguel Milano is the new COO, Rohan Kumar picked up engineering two months in, and the chief trust officer leaves October 15.

Salesforce's AI Jobs Never Arrived
A 2025 study found 72 prompt engineer vacancies across 20,000 LinkedIn listings. Salesforce's operating margin hit 22 percent against a 14.2 percent five-year average. Those two facts are the same story.
KeyBanc Downgrades Salesforce
KeyBanc cut Salesforce to Sector Weight on July 9 and pulled its price target, saying customer checks found no Agentforce acceleration. Shares fell near 5%, eight days after Guggenheim upgraded the same stock.

Help Agent Pay-Per-Resolution
Salesforce launched Agentforce Help Agent on June 25, 2026, with pay-per-resolution pricing at $2 per resolved issue. Here is how it works and where it breaks.
Comments
No comments yet. Start the conversation.
Sign in to share your take on this article. Your account works across every page.