
The Apex Heap Limit Went Up in Winter '27: What It Fixes and What It Doesn't
Sync heap goes 6 MB to 10 MB and async goes 12 MB to 25 MB. What sits on the heap, the sandbox setting that keeps deploys honest, and the workarounds you can delete.

The batch job fails at 3:14am. The error is System.LimitException: Apex heap size too large, the record count in the failure email is 200, and the class has not been touched in fourteen months. You drop the scope size from 200 to 50, rerun it, and it finishes. Ticket closed, nobody asks why, and the job now takes four times as many chunks to do the same work.
Every org has three or four of those. They are not bugs exactly. They are settlements, reached at an hour when nobody wanted to read a stack trace, and they quietly cost you throughput forever after.
Winter '27 moves the ceiling those settlements were negotiated against.
What actually changed
Per the Winter '27 release notes, the Apex heap limit for synchronous transactions goes from 6 MB to 10 MB, and the limit for asynchronous transactions goes from 12 MB to 25 MB. Salesforce frames it plainly: bigger heap means fewer runtime limit errors interrupting business processes.
Those are the first movements in either number in a very long time. Sync gains about 67 percent. Async more than doubles. For context, no other per-transaction governor limit in the same table moved with it. SOQL queries are still 100 sync and 200 async, DML statements are still 150, CPU time is still 10 seconds sync and 60 seconds async, and total query rows is still 50,000.
That asymmetry is the whole story of this release note. One constraint got much looser and everything around it stayed exactly where it was, which means the bottleneck in most of your slow code just moved somewhere else.
What is actually sitting on your heap
Heap is the memory your transaction holds at one moment, not the total it has touched. That distinction is where most heap intuition goes wrong.
Five things account for nearly all of it in practice.
Query results held in a list. List<Account> accts = [SELECT ... FROM Account LIMIT 10000] holds every one of those sObjects at once. Field count matters as much as row count. A query selecting 60 fields costs several times what the same query costs selecting six.
Collections you build while looping. Maps keyed by Id, sets of external ids, lists of records staged for DML. These grow across the whole loop and none of it is released until the variable goes out of scope.
Strings and Blobs. This is the quiet one. A base64 ContentVersion body, a generated PDF, a CSV you assembled in memory. String concatenation in a loop is the classic heap killer because each concatenation allocates a new string and the old ones stay allocated until garbage collection catches up.
Deserialized JSON. An integration response of 3 MB does not cost 3 MB. It costs the response string plus the object graph you deserialized it into, and the graph is usually larger than the text.
Static variables and Database.Stateful member variables. Statics live for the entire transaction. In Batch Apex, anything you declare on a class implementing Database.Stateful survives every chunk, so an accumulator that looked harmless at chunk one is carrying 400 chunks of data by the end.
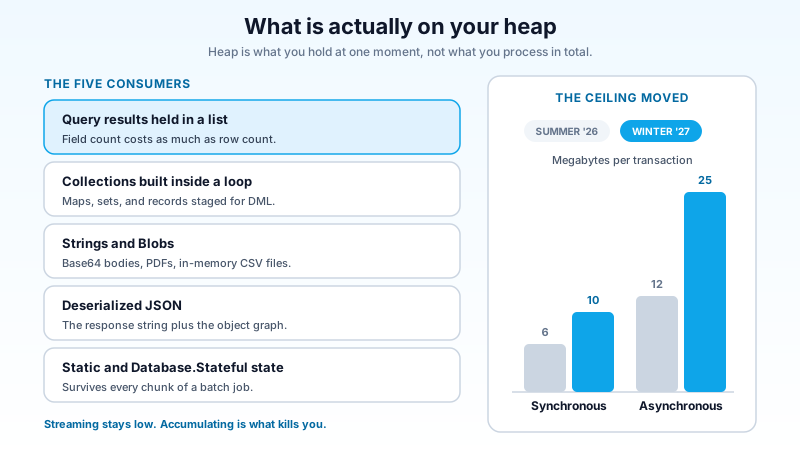
The practical read: heap pressure is almost always about how much you are holding, not how much you are processing. A query locator streaming two million records through Batch Apex can run at low heap all day. A single trigger that pulls 8,000 records into a map to avoid a second SOQL query can die at 200.
The window where sandbox and production disagree
Here is the part that will generate support tickets in September.
Winter '27 reaches sandboxes on the preview instances first, around August 28 and 29, 2026, while production instances upgrade in waves. That means a developer sandbox can be running with 10 MB and 25 MB heap while the production org it deploys to is still enforcing 6 MB and 12 MB. Code written and tested against the new ceiling compiles fine, passes tests in the sandbox, deploys clean, and then throws Apex heap size too large in production on the first real payload.
Salesforce shipped a specific control for this. In Setup, under Apex Settings, non-production orgs get a checkbox labeled Enforce the Summer '26 Apex heap limit. Turn it on in a Winter '27 sandbox and that sandbox keeps enforcing the old 6 MB and 12 MB ceilings, so anything you build there is safe to deploy into a production org that has not upgraded yet. The Apex product team has described it exactly that way: a mechanism to keep working in sandboxes with confidence that the deployment still works against the limits production currently has.
The setting is opt-in and it is temporary by design. Once your production instance is on Winter '27, the higher limit applies everywhere and the checkbox stops mattering.
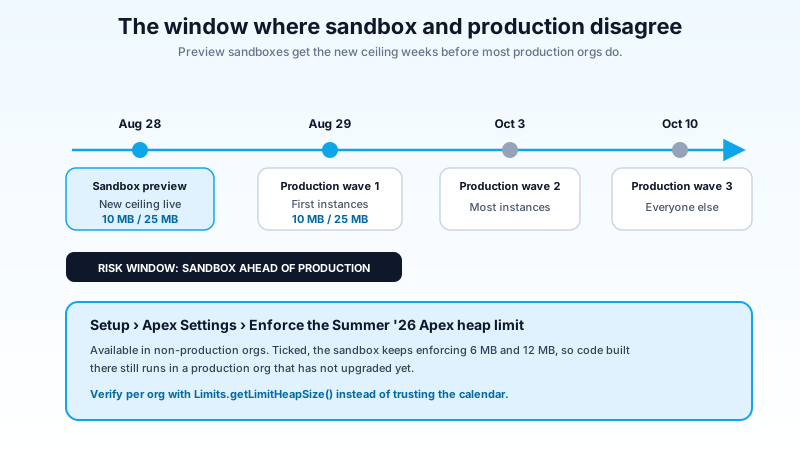
Two rules for the next six weeks. If your sandbox is on Winter '27 and your production org is not, turn the setting on and leave it on until production upgrades. And if you are actively testing whether new headroom lets you retire a workaround, do that in a separate sandbox with the setting off, so you never confuse "this passes" with "this passes where it ships". The Winter '27 sandbox preview guide covers how to get a sandbox onto the right instance before the cutoff.
Check what a given org is actually enforcing rather than trusting the release calendar:
System.debug('Heap ceiling: ' + Limits.getLimitHeapSize());
System.debug('Heap used: ' + Limits.getHeapSize());
getLimitHeapSize() returns the ceiling in bytes for the context you are running in. Run it in anonymous Apex in each org and you have your answer in ten seconds, no guessing about which wave your instance landed in.
What the extra memory genuinely fixes
Four classes of problem get materially better, and they are worth naming because they are the ones where the old limit forced bad architecture rather than better code.
Integration payloads. A 4 MB JSON response from a partner API was a real problem at 6 MB sync heap, because the response string plus the deserialized graph could clear the ceiling by itself before you did any work. At 10 MB you have room to hold both and still build a result set.
Stateful batch accumulation. Running totals, dedupe sets, error collections that you want to email at the end. Async at 25 MB gives these genuine room. The pattern of writing intermediate state to a custom object purely to survive heap, then reading it back at finish(), becomes unnecessary in most cases.
Document generation. Building a PDF or an export file in memory, where the assembled Blob and the source records are both live at once. This is the single most common place teams hit heap in synchronous context, usually from a button.
Large-map trigger patterns. Handlers that build a full map of related records to avoid repeat queries were often forced to choose between heap and the SOQL limit. There is more room to choose heap now, which is generally the right trade.
If you have a Queueable chain that exists purely because one link kept dying on memory, it is a strong candidate for consolidation. Async doubling is a big change and chained jobs carry real operational cost: more rows in the queue, more failure points, harder debugging. The async Apex guide covers when chaining earns its keep for reasons other than memory, which is the test to apply before you collapse one.
What it does not fix
Read this section before you delete anything.
Every other governor limit is unchanged. More memory means you can hold more records, which usually means you loop over more records, which spends CPU time. The 10-second synchronous CPU limit is the most common wall teams hit right after they stop hitting heap. A trigger that now happily loads 12,000 records into memory can still fail at Apex CPU time limit exceeded on the very next line. Keep the governor limits cheat sheet open while you refactor, because the limit that catches you next is rarely the one you were optimizing against.
Query rows is still 50,000 per transaction. Heap never was your row ceiling and it still is not.
The callout size limit is documented separately. The limits quick reference lists maximum callout request or response size as 6 MB for synchronous Apex and 12 MB for asynchronous Apex. Those figures happen to match the old heap numbers, and the Winter '27 release note names heap specifically, not callouts. Do not assume a 20 MB response body will suddenly come back clean. Test it in a preview sandbox against the actual endpoint before you plan around it.
Old orgs and old API versions behave differently. The heap change is a platform-level enforcement change rather than an opt-in per class, but the surrounding Winter '27 changes are not. Apex triggers running without sharing for database operations applies from API version 67.0 and later, for example. If your classes are pinned at API 52, you are living in a different set of behaviors than the release notes describe.
Managed package code is not yours. A heap error thrown inside a managed package still fails your transaction, and the package's own limits and design do not change because your org's ceiling moved.
Measure, then change one thing
The temptation is to go find every heap workaround and revert it. Do not do that. Measure first, because half of those workarounds are load-bearing for a limit that did not move.
The instrumentation is two method calls and it belongs in any long-running Apex you own:
private static void logHeap(String stage) {
    Integer used = Limits.getHeapSize();
    Integer max = Limits.getLimitHeapSize();
    System.debug(LoggingLevel.WARN, stage + ': ' +
        used + ' / ' + max + ' bytes (' +
        ((used * 100) / max) + '%)');
}
Call it at three points: after your queries load, at the midpoint of your main loop, and immediately before your final DML. Three numbers tell you the shape of the curve. If heap is flat across the loop, your collections are not the problem and the workaround protecting them can go. If it climbs steadily, you are accumulating, and the question becomes whether the new ceiling is enough for your worst realistic volume rather than your average one.
Set your threshold against real data, not the limit. If a batch chunk peaks at 9 MB against a 25 MB ceiling, that is comfortable. If it peaks at 22 MB, you have moved the failure from every night to the one night in March when volume triples.
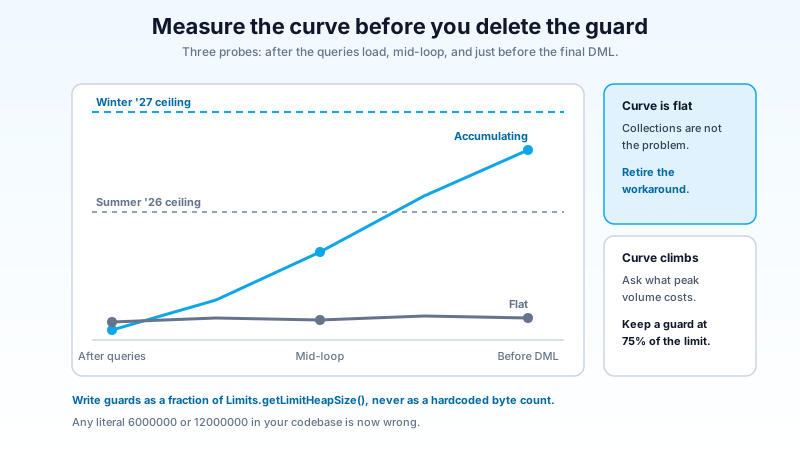
For runtime safety in genuinely variable workloads, guard instead of hoping:
if (Limits.getHeapSize() > (Limits.getLimitHeapSize() * 3 / 4)) {
    // flush what you have, clear the collection, continue
}
Writing it as a fraction of getLimitHeapSize() rather than a hardcoded byte count means the guard adjusts itself when the ceiling moves again. Any code with a literal 6000000 or 12000000 in it is now wrong, and grepping for those two numbers across your repo is a five-minute job with a real payoff.
Which workarounds to retire and which to keep
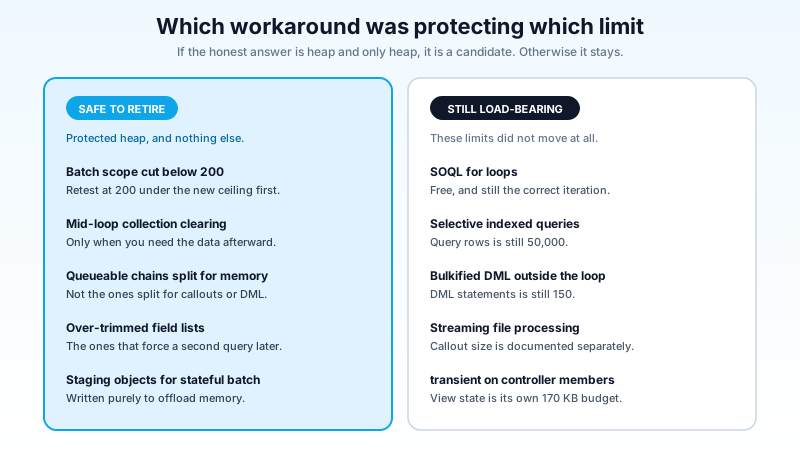
Retire these. Batch scope sizes cut below 200 purely to survive heap, once you have measured the peak at 200 under the new ceiling. Mid-loop clear() calls on collections you actually need afterward. Queueable chains that exist only to split memory rather than to split callouts or DML transactions. Field lists trimmed so aggressively that the code re-queries later for the fields it dropped. Custom-object staging tables written purely to offload stateful batch memory.
Keep these. SOQL for loops, which cost nothing and are simply the correct way to iterate a large result set. Selective queries with indexed filters, because that is a query performance concern and always was. Bulkified DML outside the loop, which is about the 150-statement limit. Streaming rather than accumulating in file processing, because file sizes grow faster than platform limits do. The transient keyword on Visualforce controller members, which is about view state, a separate 170 KB budget the heap change does not touch.
The test that decides it: write down which limit each workaround was protecting. If the honest answer is heap and only heap, it is a candidate. If it is protecting CPU, query rows, DML count, view state, or query selectivity, leave it alone. Most workarounds in a mature org turn out to be protecting two things at once, and only one of them moved.
Cover the change with a test class that asserts against real volume. A test that passes with 20 records proves nothing about a limit measured in megabytes.
What to do this week
Run Limits.getLimitHeapSize() in anonymous Apex in production and in every sandbox you deploy from, and write the two numbers down. If they disagree, turn on Enforce the Summer '26 Apex heap limit in the sandbox today, before someone deploys against a ceiling production does not have yet. Then grep your codebase for hardcoded 6000000 and 12000000 thresholds and rewrite them against Limits.getLimitHeapSize(), so the next time this number moves your guards move with it.
Everything else can wait for the measurement pass. Higher limits are worth having. They are not worth deleting a safeguard you never actually diagnosed.
About the Author
Dipojjal Chakrabarti is a B2C Solution Architect with 29 Salesforce certifications and over 13 years in the Salesforce ecosystem. He writes and edits salesforcedictionary.com, published by KineticBit Inc., to help admins, developers, architects, and cert/interview candidates sharpen their fundamentals. More about Dipojjal.
Share this article
Sources
- Winter '27 Release Notes: Increased Apex Heap Limits (Salesforce Help)
- Apex Governor Limits (Salesforce Developer Limits and Allocations Quick Reference)
- Build Better Apex Scripts to Manage Heap Limits (Salesforce Help)
- Error: Apex Heap Size Too Large (Salesforce Help)
- Top 10 Salesforce Winter '27 Features for Developers (Salesforce Ben)
Related dictionary terms
Practise it
Five questions on Platform Developer I
Exam-style questions with an explanation after each one. No account needed, and your answers build a weak-topic map once you have one.
Keep reading

Async Apex: The Complete 2026 Guide to Batch, Queueable, Schedulable & Future Methods
The complete 2026 guide to async Apex - Future, Queueable, Batch, and Schedulable. When to pick each, the Flex Queue, chaining, monitoring, and the production patterns that scale.

Salesforce Governor Limits Explained: The 2026 Cheat Sheet (with Examples)
The canonical 2026 cheat sheet: SOQL/DML/CPU/heap limits, sync vs async, the most-hit limits in production, and 10 patterns to keep your org out of the red.

Salesforce Winter '27 Release: Dates, Sandbox Preview, and the Updates That Will Break Things
Winter '27 hits sandboxes around August 29, 2026, and it retires the OAuth Username-Password flow for good. The dates, the preview mechanics, and a one-week prep plan.
Comments
No comments yet. Start the conversation.
Sign in to join the discussion. Your account works across every page.