
Salesforce Web Console: What the In-Org IDE Replaces, What It Doesn't, and When to Reach for It
A browser IDE that ships inside the org, off by default, read-only in production, and missing two things you probably still need. Here is the honest scope.

The escalation lands at 4:50 on a Friday. A scheduled batch job failed in production overnight, three thousand records are sitting in the wrong status, and you are on a borrowed laptop with no CLI, no JDK, and no VS Code workspace. So you open Developer Console, wait for the log list to paint, and start scrolling a raw execution log in a text pane that has not meaningfully changed since 2013.
Since April 14, 2026, that is no longer the only option in the org. Salesforce opened the beta for Web Console, a browser-based IDE that runs inside Salesforce itself, alongside the Summer '26 release. It is off by default, it is read-only against production, and it is missing two features you probably use every week. It is also the first serious attempt to fix in-org tooling in over a decade, and it deserves a careful read rather than a shrug.
What Web Console actually is
Web Console is a code editor and debugging surface that loads inside your Salesforce org, from a link in the top-right of the interface. No install, no local Java runtime, no sf command, no authenticated project folder. You are already logged in, so the tool is already scoped to your user.
Under the hood it runs the same web editor engine that powers VS Code in the browser, which means the things you expect from a modern editor are present: syntax highlighting that keeps up, autocomplete on Apex classes, methods and SObject fields, go-to-definition on Cmd or Ctrl click, inline error markers before you save, and a dark theme that does not look like a 2011 admin page.
That matters more than it sounds. Developer Console's editor has been on borrowed time for years, and its autocomplete quietly stopped working properly a while back. Anyone who has tried to read a 40,000-line execution log in that window knows the actual cost: not the missing features, the wasted minutes.
The scope of the beta is narrow on purpose. Salesforce's framing is that developers should not have to leave Salesforce to investigate something in Salesforce. This is a tool for the reactive hour, the one where something broke and you need to see why. It is not trying to be your project environment.
Turning it on takes about two minutes
Web Console ships disabled. An admin has to enable it before anyone sees the link:
- Open Setup.
- Search for Web Console in the Quick Find box.
- Open the Web Console (Beta) page and toggle it to Active.
That is the whole enablement. There is no permission set to build, no package to install, no connected app to authorise. Access inside the tool is governed by the permissions the user already has: object and field access, Apex class access, and the standard "Author Apex" style controls all still apply. A user who cannot see a field in a report cannot see it in a Web Console query either.
Enable it in a sandbox first. It is a beta, and beta here means real rough edges rather than marketing caution.
What shipped in the beta, and what didn't
The beta covers the investigation loop end to end, and stops there.
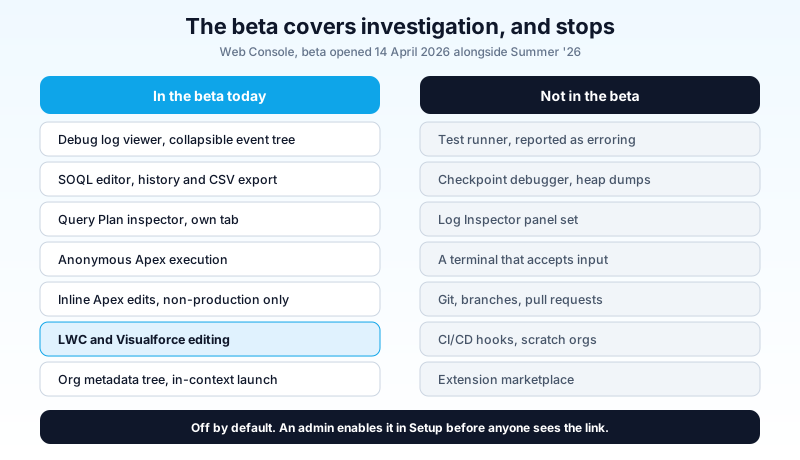
On the shipped side:
- Debug log viewer. Debug logs render as a collapsible tree of events (DML, SOQL, callouts, user debug statements) rather than a wall of pipe-delimited text, with a timeline showing where the transaction actually spent its time. SOQL rows expand inline so you can see what a query returned without re-running it.
- SOQL editor. SOQL queries with a schema-aware field picker, relationship traversal, query history you can search, and CSV export of results.
- Query Plan inspector. A dedicated tab, rather than the checkbox buried in Developer Console that half the ecosystem has never found.
- Anonymous Apex. Run ad hoc code without creating a class, same as before, in an editor that does not fight you.
- Inline Apex editing. View and edit classes and triggers in context, in sandboxes and other non-production orgs.
- LWC and Visualforce. Browse and edit Lightning Web Component bundles and Visualforce pages. Developer Console never supported LWC at all, so for a large slice of modern codebases this is the difference between "usable" and "not".
- Metadata browsing. An org-aware file tree, so you can find the class you want without knowing its exact name.
- Context-aware launch. Clicking through from a page like Apex Jobs opens Web Console with the relevant code already loaded.
On the missing side, and this is where you need to read carefully:
- No test runner. Running tests from the command palette has been reported as erroring during the beta. If your workflow is "make a change, run the class's tests, check code coverage", Web Console does not close that loop today.
- No checkpoint debugger. Developer Console's checkpoints, with heap dumps and variable inspection at a line, have no equivalent.
- No Log Inspector panel set. Stack Tree, Execution Stack, Execution Log, Source, Variables, Execution Overview: none of those panels have a one-to-one replacement. The new tree view is better for most reading, but if you have built muscle memory around Execution Overview for performance work, that muscle memory does not transfer.
- A terminal that is decorative. The panel exists in the UI and accepts no input. No CLI, no scratch org creation.
- No source control, no CI/CD, no extension marketplace. Nothing here writes to a git branch or fires a pipeline.
That last group is not an oversight. It is the product boundary.
Production is read-only, and that is the right call
In production orgs, Apex in Web Console is read-only. You can read a class, you can read the log, you can run a query. You cannot save an edit.
Some developers will read that as a limitation. It is a guardrail, and a good one. The single worst habit in the Salesforce ecosystem is the production hotfix typed into a browser at 11pm with no test run, no review, and no record of what changed. Web Console declines to make that easier. If the fix belongs in production, it goes through a sandbox and a deployment like everything else.
What you get instead is the thing you actually needed at 4:50 on that Friday: full read access to production code and logs, from any machine with a browser, in a tool that renders the log in a form a human can scan.
Where it sits next to the other three tools
Four tools now overlap in the Salesforce developer's day, and the overlap confuses people. The useful question is not which one is best. It is which one you reach for when a specific thing happens.
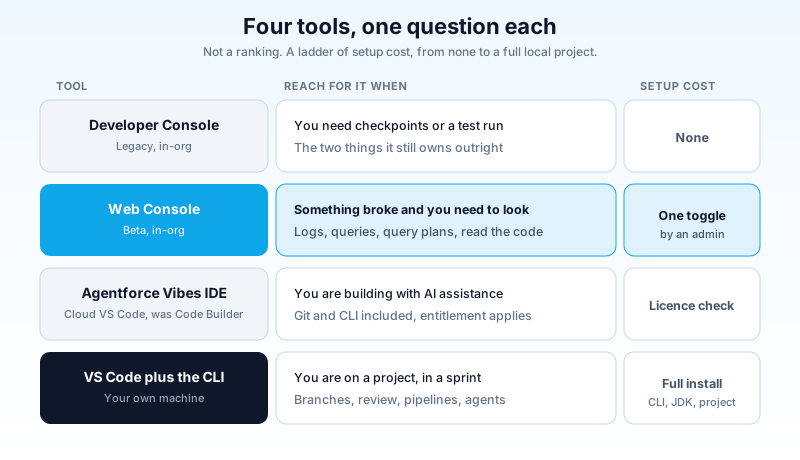
Developer Console is the legacy in-org tool. Still there, still works, still the only place with checkpoints and a working test runner. Nobody should be starting new habits here.
Web Console is the new in-org tool for investigation: read a log, run a query, check a query plan, read the code, make a small edit in a sandbox. Zero setup, available on any machine.
Agentforce Vibes IDE, previously Code Builder, is the full cloud VS Code environment with the AI layer, git, and CLI access. This is where sustained AI-assisted building happens, and it carries an entitlement question that Web Console does not. Our Agentforce Vibes guide covers what it is good at.
VS Code plus the Salesforce CLI on your own machine is still where real project work lives: source-tracked development, branches, code review, pipelines, and whatever AI coding agent you have wired in. If you have not set that up properly, our Claude Code and VS Code setup guide walks through it.
Read those four as a ladder of commitment, not a ranking. Web Console's advantage is that it costs nothing to reach: no install, no entitlement negotiation, no laptop. It wins the first five minutes of an incident and loses the next five hours of a project.
Who this is actually for
Three groups get real value on day one.
Developers doing production triage. You are looking, not building. Read-only is exactly the access level you want, and the log tree beats scrolling raw text by a wide margin.
Admins and consultants who are Apex-adjacent. The people who need to read a debug log twice a month, run a query the report builder cannot express, or check whether a trigger is doing what a vendor claims. Standing up a full local environment for that has never been worth it. This is the tool that finally fits the frequency of the work.
Teams with edition or region constraints. Web Console is reported to run across Developer, Professional, Enterprise, Unlimited and Performance editions, and community write-ups place it in Government Cloud and China Cloud too, where Agentforce Vibes has not reached. If you work in a regulated org that has been stuck on Developer Console because the newer tooling was not available to you, check your own org before you assume you are excluded again. That is a real gap being closed for a group that usually waits years.
The group that gets the least value: developers with a working local setup, on a project, mid-sprint. Web Console gives them nothing their environment does not already do better. That is fine. They are not the audience.
The workflow that actually changes
Here is the loop that gets shorter.
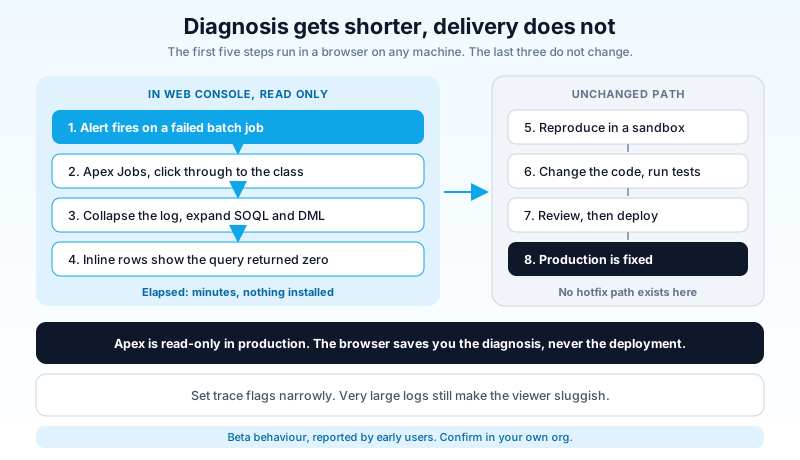
An alert fires. You open the org from whatever machine you have and go to Apex Jobs. You click through to the failed job and land in Web Console with the class already open. You pull the debug log, collapse everything, and expand only the SOQL and DML events until you find the statement that returned zero rows. You expand the inline results to confirm. You open the SOQL tab, run the query against production with a wider filter, and see that a record type introduced last week is not being matched.
Total elapsed: minutes, on a laptop with nothing installed.
Then the fix goes the normal way. Sandbox, code change, tests, deployment. Web Console shortened the diagnosis, not the delivery, and confusing those two is how orgs end up with untested production code. The diagnosis is usually the part that ate your evening anyway.
One caution on logs. Verbose logging in a production org fills log storage fast, and community reports suggest large logs (past roughly 5 MB) still make the viewer sluggish. Set your trace flags at the level you need, not the level that captures everything.
Is Developer Console dying?
There is no announced retirement date. Salesforce has not published one, and the Web Console beta itself is positioned as a modern alternative rather than a feature-for-feature replacement.
But read the shape of it. Developer Console has received no meaningful investment in years, lost autocomplete along the way, and never supported LWC. Web Console covers most of its daily surface and does it better. The two features Developer Console still owns outright, checkpoints and the test runner, are exactly the kind of gap a beta closes before general availability.
My read: Developer Console has years left as a menu item and months left as a default. Treat it the way you treat any tool with a successor already shipping. Stop teaching it to new hires, stop writing runbooks that depend on it, and keep it in your back pocket for checkpoints until Web Console has an answer.
There is a practical reason to engage now rather than wait. The beta has a public feedback repository, forcedotcom/web-console-feedback, where bugs and feature requests go on the record. Betas that get specific, well-argued feedback ship better than betas that get ignored and then get complained about at general availability. If the missing Execution Overview would cost your team real time, that is worth writing down where the product team reads it.
How to roll it out without a fight
Four steps, roughly a sprint of elapsed calendar time and about two hours of actual work.
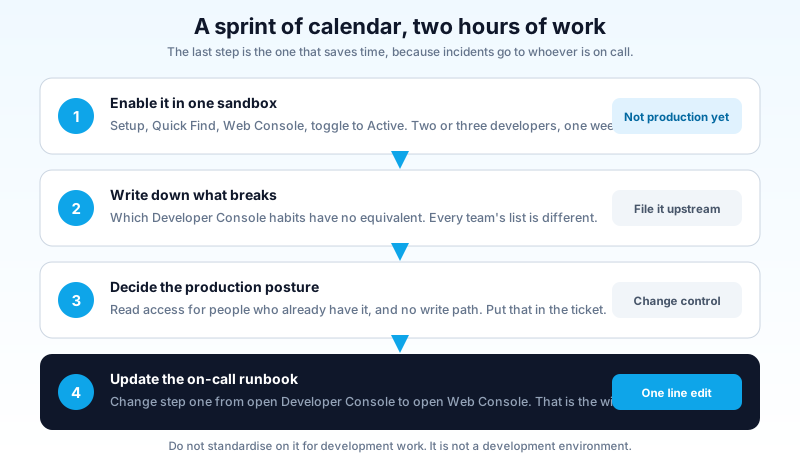
Enable it in one sandbox. Not production yet. Give it to two or three developers and ask them to use it for one week of debugging instead of Developer Console.
Write down what breaks. Specifically, which Developer Console habits have no equivalent. Every team's list is different. A team that lives in checkpoints will hit a wall on day one. A team that mostly reads logs may never notice a gap.
Decide the production posture. Enabling it in production gives read access to code and logs for anyone who already has that access, and no write path. For most orgs that is a straightforward yes. For orgs with strict change-control paperwork, get the read-only behaviour written into the ticket rather than arguing about it later.
Update the runbook. Whatever document tells an on-call engineer how to investigate a failed job, change the first step from "open Developer Console" to "open Web Console". That single edit is where the time saving actually lands, because incidents are handled by whoever is on call, not by whoever tried the new tool.
Do not standardise on it for development work. It is not a development environment and does not claim to be. Web Console is for the hour where something is wrong and you need to see the org clearly. Judged on that, it is the best in-org tooling Salesforce has shipped in a decade. Judged on anything else, it is a beta with a decorative terminal.
Open Setup in your sandbox, search Web Console, flip it to Active, and spend your next debug log in it instead of Developer Console. You will know inside twenty minutes whether it belongs in your team's runbook, and that is a cheaper evaluation than reading one more comparison table.
About the Author
Dipojjal Chakrabarti is a B2C Solution Architect with 29 Salesforce certifications and over 13 years in the Salesforce ecosystem. He writes and edits salesforcedictionary.com, published by KineticBit Inc., to help admins, developers, architects, and cert/interview candidates sharpen their fundamentals. More about Dipojjal.
Share this article
Sources
- Introducing Web Console (Beta): Code Where You Build on Salesforce
- Introduction to Web Console | Salesforce Developer Docs
- forcedotcom/web-console-feedback (official beta feedback repo)
- Salesforce Ben: Could the New Salesforce Web Console Mark the End for Developer Console?
- Apex Hours: Salesforce Web Console (Beta), the Modern Developer Workspace Built Into Your Org
Related dictionary terms
Practise it
Five questions on Platform Developer I
Exam-style questions with an explanation after each one. No account needed, and your answers build a weak-topic map once you have one.
Keep reading

The Apex Heap Limit Went Up in Winter '27: What It Fixes and What It Doesn't
Your batch job died at 3am on a heap error and you cut the scope size to 50 to make it stop. Winter '27 raises sync heap to 10 MB and async to 25 MB. Here is what that actually changes in your code.
How to Set Up VS Code and Claude Code for Salesforce Development in 2026
You have a Salesforce org and nothing else. Here is the exact 2026 setup that wires VS Code, the Salesforce CLI, and Claude Code into one workflow that writes Apex with your metadata as context.

Agentforce Vibes and React on Salesforce
Agentforce Vibes 2.0 and the Multi-Framework runtime let you build native React apps on Salesforce from natural language. Here is how the workflow, the SDK, and the beta limits actually work in 2026.
Comments
No comments yet. Start the conversation.
Sign in to join the discussion. Your account works across every page.