
CRM Analytics
CRM Analytics is Salesforce's separately licensed analytics platform for large data volumes.
Definition
CRM Analytics is Salesforce's separately licensed analytics platform for large data volumes. You build interactive dashboards on it, then embed them inside Sales Cloud and Service Cloud record pages. It keeps data in its own columnar, in-memory engine instead of querying Salesforce objects directly.
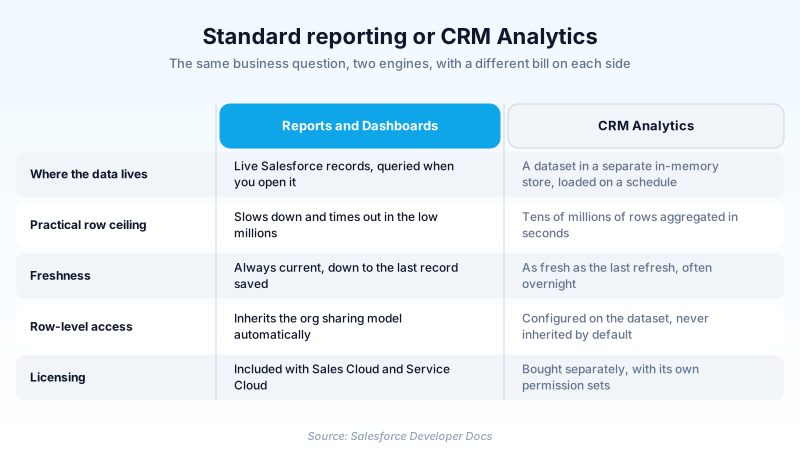
That separation is the entire point. Standard reports read live records and apply the sharing model row by row. Correct, but it slows badly once you cross a few million rows. CRM Analytics loads data into a dataset ahead of time and indexes it for aggregation. Questions that used to time out come back in seconds. The trade is that a dataset is a snapshot on a refresh schedule, not live data.
The product carries three former names: Wave Analytics, then Einstein Analytics, then Tableau CRM. CRM Analytics is the current one, and the Summer '26 developer guides still use it everywhere. Salesforce also sells Tableau and the newer Tableau Next, so the analytics portfolio now has more than one front door.
In plain English
“Imagine a filing cabinet holding ten million receipts. Counting them one at a time takes all afternoon, so instead someone tallies them up every night. CRM Analytics is that nightly tally, plus a set of charts you can click into to see how each total was built.”
Worked example
A distributor with roughly 14 million order line rows wants reps to see margin by product line on the account record. Standard reports time out, so the team builds a CRM Analytics dataset that combines order lines with product and account data, refreshed nightly at 02:00. A dashboard groups on Product_Family__c, measures SUM(Margin__c), and filters on the account Id passed in from the host page. The dashboard is embedded on the Account Lightning page through the CRM Analytics Dashboard component, bound to the record Id. A rep opening a large account sees margin for that account only, in about two seconds, against data that is at most 24 hours old. The sales team took that staleness happily in exchange for a report that actually finishes.
How CRM Analytics stores, queries, and surfaces data
The dataset is the unit of everything
Everything in CRM Analytics runs against a dataset, never against your Salesforce objects at run time. A dataset is a columnar structure built for aggregation rather than for record retrieval. Fields land as either dimensions (things you group by) or measures (things you add up). That classification is fixed when the dataset is built. A numeric field typed as a dimension will not sum until you rebuild it. Datasets can be fed from Salesforce objects, external databases, data lakes, and flat files. For file loads, the External Data API is the documented route. You create an InsightsExternalData record describing the target dataset and its metadata, attach the file as InsightsExternalDataPart records, then set the action to Process. Parts are capped at 10 MB each, so anything larger has to be split before it is sent. That API has been available since API version 31.
Two query languages, and you will meet both
SAQL, the Salesforce Analytics Query Language, is the native one. The developer guide is blunt about how present it is. CRM Analytics uses SAQL behind the scenes in lenses, dashboards, and explorer to gather data for visualizations. Every chart you build in the UI is generating SAQL whether you look at it or not. There is also SQL for CRM Analytics, an ANSI SQL interface onto the same in-memory store. If you came from a database background it will feel far more natural than SAQL's stream-and-pipe syntax. The catch is stated in the docs: these features do not support the full range of cases covered by ANSI SQL. Expect to start in SQL, hit something it will not express, and finish that particular query in SAQL. Budget for learning both rather than picking a side.
Lenses, dashboards, and the bindings that wire them together
A lens is a single saved exploration, one question against one dataset. A dashboard assembles widgets, and each widget carries its own query. Standard Salesforce dashboards manage that much already, since their components can each read a different report on a different object. The CRM Analytics difference sits one level down: blending sources inside a single query, and wiring widgets to each other. Bindings are what separate a CRM Analytics dashboard from a grid of charts. A binding lets one widget's state feed another widget's query. Select a region in a chart and the filter on the table beside it rewrites itself. Flip a toggle and every other widget switches which measure it reports on. The cost is that bindings are written as expressions in the dashboard JSON, not configured through a picker. Your first serious dashboard will involve reading raw JSON and counting braces.
Data Prep recipes, and the dataflows they replaced
Getting data into a usable dataset is most of the work, and rarely a straight copy. You are joining objects, filtering out test records, deriving buckets, and aggregating to the grain the dashboard needs. Data Prep recipes are the current tool for that. A recipe is a visual graph of input nodes, joins, transforms, aggregations, and outputs, readable without decoding anything. They are also addressable programmatically. Per the Recipe REST API docs, you can access Data Prep recipes for CDP, Salesforce Data Pipelines, and CRM Analytics. Treat the CDP in that sentence as a fossil. It was the short name for Customer Data Platform, which became Data Cloud and now ships as Data 360 in the developer docs. The API itself runs, schedules, and synchronizes recipes, and reads or updates their metadata. The older approach was dataflows, defined in hand-edited JSON. Plenty of long-lived orgs still have dataflows running that nobody wants to touch. Moving one to a recipe is a rebuild, not a conversion.
Einstein Discovery is a layer on top, not a feature inside
Einstein Discovery runs statistical analysis over a dataset and produces a story, which explains what drives an outcome. Promote a story to a model and it starts generating predictions. Those predictions can be written onto records. A churn score or a win likelihood lands as a field on the Account or Opportunity, not only inside a dashboard. Its REST API exposes predictions, models, and stories as resources. The shape of that API tells you how separate the product is. Discovery has its own surface and its own documentation set, sitting on CRM Analytics data. In most orgs it is licensed and permissioned separately too. Treating Discovery as a checkbox inside CRM Analytics is how projects end up three weeks in before anyone checks whether the licences were bought.
Embedding is where most of the value actually lands
A dashboard nobody opens is worth nothing. The version that pays for itself sits on a record page, already filtered to that record. It is in front of someone who was going to open that page anyway. The CRM Analytics Dashboard component handles this on Lightning pages, taking the host record's Id and passing it into the dashboard's filters. You can also push custom code the other way. The developer guide lists what such a widget can be: a custom data visualization, a custom selection control, a richly formatted custom document, and more. They render on the dashboard canvas as native widgets rather than as bolted-on frames. Read the published count limit carefully, because it belongs to the neighbouring product. A standard Lightning dashboard accepts only one custom Lightning Web Component. A CRM Analytics dashboard can hold one or more of them. A layout with four custom widgets is a design question, not a limit question.
Row-level security does not come along for free
This is the finding that shows up in almost every CRM Analytics review. It surprises admins who trust the platform's sharing model everywhere else. A dataset is a copy of data in a separate store. It does not automatically inherit the object sharing rules that governed the records it was built from. Access has to be configured on the dataset itself. You either inherit sharing from a source object, or you write a predicate tying rows to the running user. Until you do one of those, a dataset built from Opportunity can cheerfully show every rep the whole company's pipeline, quickly and beautifully. Build the security in the same sprint you build the dataset. Retrofitting means reloading and re-testing every dashboard that reads from it.
Where Salesforce's analytics attention is going
CRM Analytics is not being wound down. Its developer guides sit at API version 67.0 for Summer '26, and none of them carries a retirement or migration notice. The new spending is visible elsewhere. Tableau Next is the newer analytics product. Trailhead files its quick-look badge under AI analytics skills, and folds it into Data 360 certification prep. That is a roadmap signal, not a shutdown notice. New agentic and generative analytics work is landing on Tableau Next. CRM Analytics keeps serving the orgs already built on it. If you are picking a platform for a greenfield build, ask which one Salesforce is funding. That question is cheaper to ask before a five-year commitment than after. The metadata gives you a second anchor. Upload objects are still called InsightsExternalData, and developer guides still sit under bi_dev_guide paths, where the 'bi' predates every rebrand. When the marketing name and the metadata disagree, trust the metadata.
How organizations use CRM Analytics
Loads three years of order line history, roughly 40 million rows, into a single dataset and gives regional managers a margin-by-product-line dashboard that standard reports could never finish rendering.
Embeds a claims-history dashboard on the Account page so adjusters see prior claim volume and average settlement in context, without opening a second tab or a second system.
Runs an Einstein Discovery story across closed opportunities, promotes it to a model, and writes a churn-risk score back onto the Account so it can be used in ordinary list views and reports.
Blends Salesforce donation records with a warehouse extract in one Data Prep recipe, then reports on donor retention across both systems from a single dataset.
Trust & references
Cross-checked against the following references.
- CRM Analytics REST API Developer Guide: Overview (opens in new tab)Salesforce
- CRM Analytics SAQL Developer Guide: SAQL Overview (opens in new tab)Salesforce
- CRM Analytics External Data API: Overview (opens in new tab)Salesforce
- Einstein Discovery REST API: Overview (opens in new tab)Salesforce
- Data 360 Ingestion API: Get Started (opens in new tab)Salesforce
Straight from the source - Salesforce's reference material on CRM Analytics.
Hands-on resources to go deeper on CRM Analytics.
About the Author
Dipojjal Chakrabarti is a B2C Solution Architect with 29 Salesforce certifications and over 13 years in the Salesforce ecosystem. He writes and edits salesforcedictionary.com, published by KineticBit Inc., to help admins, developers, architects, and cert/interview candidates sharpen their fundamentals. More about Dipojjal.
Test your knowledge
+5 pts / dayQ1. What is the main architectural difference between a CRM Analytics dataset and a standard Salesforce report?
Q2. Which sequence of product names has this platform actually carried?
Q3. You want four custom Lightning Web Components on one CRM Analytics dashboard. What do the docs allow?
Q4. What does Einstein Discovery add on top of CRM Analytics?
Q5. You need to load a 60 MB CSV into a dataset through the External Data API. What has to happen first?
Discussion
Loading discussion…