
Advanced Function
An Advanced Function is one of the twelve formula functions Salesforce files under the Advanced Functions heading of its formula reference.
Definition
An Advanced Function is one of the twelve formula functions Salesforce files under the Advanced Functions heading of its formula reference. The twelve are CURRENCYRATE, GETRECORDIDS, IMAGEPROXYURL, INCLUDE, ISCHANGED, JUNCTIONIDLIST, LINKTO, PREDICT, REGEX, REQUIRESCRIPT, URLFOR and VLOOKUP.
The label describes company, not difficulty. Every other category in that reference is sorted by data type: Date and Time, Logical, Math, Text. Advanced is the leftover heading, and its members reach past the record in front of them.
They behave nothing alike and they are allowed in different places. Several exist to serve a generation of the platform that Lightning Experience no longer runs.
In plain English
“Salesforce lets you write small calculations that fill in a value by themselves. Most of the building blocks are sorted by what they work on: numbers, words, dates. Advanced is the shelf where the leftovers went, so the things sitting on it have almost nothing in common.”
Worked example
A regional insurance brokerage keeps a custom object, Approved_Zip__c, where Name holds the ZIP code and Territory__c holds the assigned territory. Agents kept entering ZIP codes no territory covered. An admin adds a validation rule on Policy__c whose formula is VLOOKUP($ObjectType.Approved_Zip__c.Fields.Territory__c, $ObjectType.Approved_Zip__c.Fields.Name, Service_Zip__c) = "". A policy with Service_Zip__c set to 60614 saves fine, because a matching row exists. Set it to 99999 and VLOOKUP comes back blank, the formula returns TRUE, and the save is blocked. Paste that same expression into a formula field and Check Syntax rejects it outright.
What is actually inside the Advanced Functions bucket
Why the label misleads almost everyone
Reading the name as a skill level is the mistake almost everyone makes, and it costs real time. ISCHANGED is trivial to write, one field reference and a comparison, and it sits in Advanced. A nested IF spanning three related objects is genuinely hard, and it sits in Logical. So people go hunting here the moment a formula gets difficult, and leave more confused than they arrived. What the heading does predict, loosely, is that the function comes with rules about where you may put it. That is the part that bites.
Advanced Functions are not report summary functions
This is the mix-up worth clearing up first, because plenty of older writing online has it backwards. PARENTGROUPVAL and PREVGROUPVAL sit in their own Summary Functions category, not this one. Those are the two people reach for when they want percent of grand total or a month over month delta. Their rules are tighter than anything under Advanced. Salesforce documents them as usable only inside custom summary formulas, and only on summary, matrix and joined reports. Each has to sit at a grouping level rather than the grand summary. If you came here to compute a running share of pipeline, the report builder is where you write it.
Five of the twelve are s-control era relics
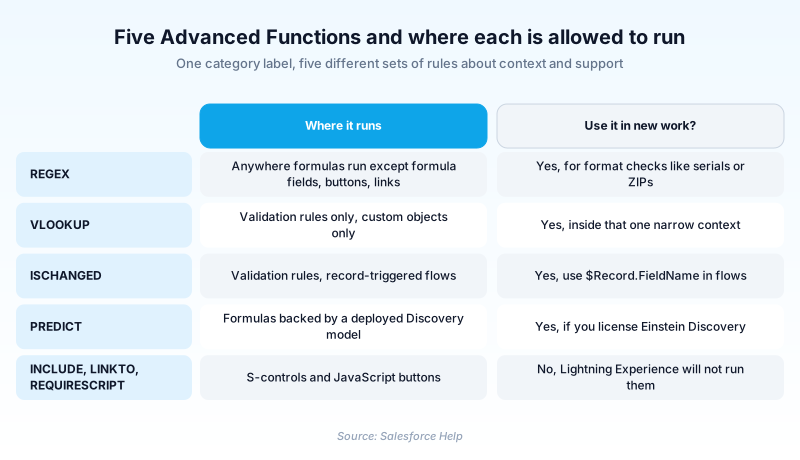
GETRECORDIDS, INCLUDE, LINKTO, REQUIRESCRIPT and URLFOR all exist to serve s-controls and the JavaScript custom buttons built on them. INCLUDE reuses an s-control snippet and LINKTO returns a relative link to one. REQUIRESCRIPT emits a script tag for the AJAX Toolkit. GETRECORDIDS hands back the record IDs a user ticked in a list view. Visualforce superseded s-controls, and an org that never created one cannot create one now. JavaScript buttons do not execute in Lightning Experience. URLFOR is the one still worth knowing, because Visualforce pages use it to resolve a file inside a static resource archive. The other four are maintenance archaeology. When you meet them, the honest answer is usually a Quick Action, a screen flow, or Apex.
REGEX and VLOOKUP, the two that earn their keep
REGEX and VLOOKUP are the members most admins write on purpose. REGEX compares a text value to a regular expression and returns TRUE on a match. That makes it the cleanest declarative way to hold a data format steady. It also carries the restriction people trip over hardest. Salesforce documents REGEX as available everywhere a formula runs apart from formula fields, custom buttons, and custom links. So write it in the validation rule, not the calculated field you were probably picturing. VLOOKUP is the more hemmed-in of the pair. It reads a value off a custom object by matching against that object's Name field, the closest the point-and-click platform gets to a spreadsheet lookup. It runs in validation rules and nowhere else. Checking an entered value against a reference table is exactly what VLOOKUP is for. Displaying that value on the record is exactly what it refuses to do.
Context restrictions are the real difficulty
Know the rest by name, so you recognise them in someone else's org. ISCHANGED compares a field against its previous value. Record-triggered flows accept it if you reference $Record.FieldName rather than the object name. CURRENCYRATE returns the conversion rate to your corporate currency for an ISO code. Hand it an invalid code and it returns 1.0, so a typo converts silently at par. IMAGEPROXYURL retrieves an external image without exposing user credentials. JUNCTIONIDLIST builds an ID list for a many to many relationship. PREDICT scores the record against a deployed Einstein Discovery model. None of that helps if the function sits in the wrong place. Salesforce documents several of these as unsupported in flow formulas, and Check Syntax fails on context as readily as on a missing bracket.
How to reach an Advanced Function in the validation rule editor
There is no switch to turn Advanced Functions on. They live in the Functions picker inside every formula editor. Open a validation rule to see them, because that context accepts REGEX while a formula field does not.
- Open a validation rule on the object
From Setup, open Object Manager and pick the object. Click Validation Rules in the left sidebar, then click New.
- Write the condition that blocks the save
The Error Condition Formula has to return a Boolean. The rule fires and the save fails when it evaluates to TRUE.
- Filter the Functions list to Advanced
Below the formula box sits a Functions list with a category dropdown above it. Set the dropdown to Advanced.
- Insert the function and fill in its arguments
Pick the function, click Insert Selected Function, and replace the placeholder arguments. The picker only offers what the current context supports, so the list is shorter in a formula field.
- Run Check Syntax before you save
Check Syntax reports a context problem the same way it reports a typo. If the formula reads correctly, the problem is where you are writing it.
Inserts a correctly spelled field reference, including from a related object.
Comparison and logic operators, so you are not guessing.
Set it to Advanced to see this category, minus anything the context blocks.
- REGEX returns TRUE on a match and a validation rule blocks the save on TRUE. Wrap it in NOT() unless you mean to reject the values that match.
- Salesforce parses REGEX patterns with Java Platform SE 6 syntax, and every backslash has to be doubled. An expression pasted from an online tester rarely compiles first time.
Prefer this walkthrough as its own page? How to Advanced Function in Salesforce, step by step
How organizations use Advanced Function
Enforces asset serial numbers with a REGEX validation rule, so a record cannot save unless it matches the pattern its plant labels use.
Uses VLOOKUP in a validation rule to check an entered service ZIP code against a custom reference object before the policy saves.
Uses CURRENCYRATE in a formula field so a locally entered budget also shows at the corporate rate, with no nightly job to run.
Trust & references
Cross-checked against the following references.
Straight from the source - Salesforce's reference material on Advanced Function.
Hands-on resources to go deeper on Advanced Function.
About the Author
Dipojjal Chakrabarti is a B2C Solution Architect with 29 Salesforce certifications and over 13 years in the Salesforce ecosystem. He writes and edits salesforcedictionary.com, published by KineticBit Inc., to help admins, developers, architects, and cert/interview candidates sharpen their fundamentals. More about Dipojjal.
Test your knowledge
+5 pts / dayQ1. Which pair is commonly called advanced but is documented under a different category entirely?
Q2. You add a VLOOKUP formula to a new formula field on Account and Check Syntax rejects it. Why?
Q3. What do INCLUDE, LINKTO, REQUIRESCRIPT, and GETRECORDIDS have in common?
Discussion
Loading discussion…