
Analytics Groups
Analytics Groups is the informal name for the row and column groupings that fold a flat list of report records into buckets with subtotals.
Definition
Analytics Groups is the informal name for the row and column groupings that fold a flat list of report records into buckets with subtotals. Salesforce never prints the phrase itself, so do not go hunting for it in Setup. You pick a field, and every distinct value of that field becomes a section header with the matching records collected underneath.
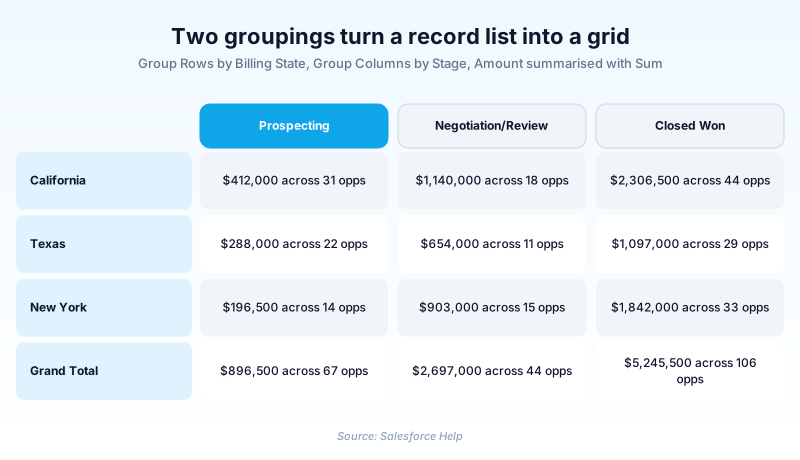
Salesforce's own labels are Group Rows and Group Columns, and both live in the Outline pane of the Lightning report builder. The format follows the groupings rather than the other way round: no groups is tabular, one row group makes it a summary report, and adding a column group makes it a matrix.
The phrase also gets used loosely inside CRM Analytics, where Public Groups decide who can open a shared app. That is grouping users for access, not records for analysis.
In plain English
“Picture a huge pile of receipts dumped on a table. Grouping is sorting that pile into smaller piles: one per shop, or one per month. Every receipt is still there, but each pile now has a total on top.”
Worked example
A sales ops analyst builds an Opportunities report for the quarterly pipeline review. In the Outline pane she sets Group Rows to Billing State/Province. That field belongs to the related Account, not the Opportunity, so the report type has to include Account fields. Group Columns goes to Close Date, and the report switches itself to matrix format. On the Close Date group she opens the menu and picks Group Dates By, then Fiscal Quarter, so the columns land on four quarters instead of hundreds of individual dates. Amount is summarised with Sum, so every cell holds the pipeline for one state in one quarter. A custom summary formula, AMOUNT:SUM - PREVGROUPVAL(AMOUNT:SUM, CLOSE_DATE), adds the quarter over quarter swing beneath each column. Two grouping choices did all of that.
How groupings behave, from the Outline pane to the dashboard
Group Rows, Group Columns, and the format that follows
Click Outline in the Lightning report builder and you get two lists: GROUP ROWS and GROUP COLUMNS. Each carries an Add group picklist, and choosing a field is the whole action. The preview's column arrow offers Group Rows by This Field as a shortcut. What you cannot do is choose the format first. Salesforce Help says it plainly: the report format automatically updates as you group report data. Admins from Salesforce Classic keep hunting for the format radio buttons that used to sit at the top. Order is editable afterwards: drag a group inside the pane, or pick Move Group Up and Move Group Down from its menu.
The grouping ceilings, and the two numbers Salesforce publishes
Summary and joined reports take up to three grouping levels. Matrix reports take two row groupings plus two column groupings, and the same field cannot sit on both axes. Expect a documentation fight here. The Build a Report in Lightning Experience help page says flatly that you can group up to two rows and two columns. It applies the matrix number to every format, while the limits page and the older grouping article both say three for summary. Treat three as the summary ceiling, two plus two as the matrix one. Need more than that and a joined report gives you five blocks, each with its own groupings.
Grouping a date beats building a formula field for it
Group by a date field and the group menu gains Group Dates By, offering day, week, month, quarter, year and the fiscal equivalents. Salesforce does the bucket arithmetic against your org's fiscal year settings, so a report grouped by Close Date, Fiscal Quarter relabels itself when finance moves the calendar. The alternative is a formula field holding a quarter string, which costs a field slot and goes quietly wrong the moment the fiscal year shifts. Grouping by raw Close Date is worse still: one section per calendar day, which is an expensive way to render a list.
Bucket fields group by values the record does not carry
Sometimes the dimension you want does not exist on the object. A bucket field builds it inside the report definition: take a field you already have, define named buckets over its values, then group by the bucket. Industry collapsed into Regulated and Unregulated, or Amount split into three bands. Nothing is written to any record, so no schema change and no deployment. The cost is reuse. Each report holds its own copy, capped at five bucket fields of twenty buckets each, and duplicates drift apart the first time somebody edits one.
Custom summary formulas address the grouping tree by name
Groupings do more than arrange rows. Custom summary formulas point at them directly. PARENTGROUPVAL(summary_field, grouping_level) reads a group above the one the formula sits in and accepts GRAND_SUMMARY as that level, which is how percent of total gets built: RowCount / PARENTGROUPVAL(RowCount, GRAND_SUMMARY). PREVGROUPVAL reaches sideways to the group before instead, giving you comparisons like AMOUNT:SUM - PREVGROUPVAL(AMOUNT:SUM, CLOSE_DATE). Because the level is an argument, deleting or reordering a grouping breaks any formula that named it. PREVGROUPVAL also returns null on the first group, so January in a twelve month report has nothing behind it.
Dashboards inherit your groupings, and cardinality decides the outcome
A chart component does not define its own categories. It reads them from the source report: the first grouping becomes the axis, the second becomes the series or the stack, and the summarised field becomes the measure. Rearranging groupings rearranges every chart downstream, which is efficient when you meant it and startling when you did not. Cardinality is where this breaks. A dashboard widget calculates up to 1,000 groupings and its totals reflect only those, so a report grouped by Account Name across 40,000 accounts still renders a chart, just with a wrong number under it.
How to add a grouping in the Lightning report builder
Grouping is not a Setup switch. It lives in the report builder, and the format changes the moment the first group lands.
- Open the report in edit mode
From the Reports tab, open the report and click Edit. Starting fresh works too, but pick the report type carefully: it decides which fields you can group by.
- Click Outline
The Outline pane holds GROUP ROWS, GROUP COLUMNS and COLUMNS. The first two lists are where all grouping happens.
- Add the group
Under GROUP ROWS, open the Add group picklist and choose a field. Repeat under GROUP COLUMNS if you want a grid rather than a stack of sections.
- Summarise a field, then save and run
Open a numeric column's menu and pick Summarize, then Sum or Average. Subtotals under each group only appear once something is being summarised.
Up to three levels on a summary or joined report, two once it becomes a matrix.
Adding one flips the report to matrix format. Two is the maximum.
On a date group: day, week, month, quarter, year, plus the fiscal versions.
- A matrix report will not let you use the same field as both a row grouping and a column grouping.
- Removing a grouping breaks any custom summary formula that named it, and you only find out when the report runs.
Prefer this walkthrough as its own page? How to Analytics Groups in Salesforce, step by step
How organizations use Analytics Groups
Groups open Cases by Product Family and then by Case Reason, which exposes that one product line generates a third of all support volume.
Groups gifts by Close Date, Fiscal Quarter with a bucket field splitting amount into Major, Mid and Small, so the board reads donor mix rather than one number.
Builds a matrix with Owner down the side and Stage across the top, so a stalled rep shows up as a fat Negotiation column.
Trust & references
Cross-checked against the following references.
- Group Your Report Data (opens in new tab)Salesforce
- Reports and Dashboards Limits and Allocations (opens in new tab)Salesforce
- PARENTGROUPVAL and PREVGROUPVAL (opens in new tab)Salesforce
- Export a Report (opens in new tab)Salesforce
- Highlight Data Ranges with Conditional Formatting (opens in new tab)Salesforce
Straight from the source - Salesforce's reference material on Analytics Groups.
Hands-on resources to go deeper on Analytics Groups.
About the Author
Dipojjal Chakrabarti is a B2C Solution Architect with 29 Salesforce certifications and over 13 years in the Salesforce ecosystem. He writes and edits salesforcedictionary.com, published by KineticBit Inc., to help admins, developers, architects, and cert/interview candidates sharpen their fundamentals. More about Dipojjal.
Test your knowledge
+5 pts / dayQ1. A matrix report is limited to how many groupings?
Q2. You open a tabular report and add one field under GROUP ROWS. What happens to the report format?
Q3. Which function reads a grouping level above the one the formula sits in, and accepts GRAND_SUMMARY as that level?
Discussion
Loading discussion…